StarTrinity SIP Tester™ - performance and hardware requirements
Performance of the StarTrinity SIP Tester depends its configuration and hardware where it is installed. Load capacity greatly depends on the CPU - clock frequence and number of cores. 1GB of RAM is enough for the tests. This page contains performance reports of SIP Tester with various hardware and operating modes. Based on these reports, you can estimate hardware requirements for your own testing, as CPU load linearly depends on number of channels. We tested first instance of SIP Tester (UAS, call receiver) by another instance of SIP Tester (UAC, call generator) installed on a more powerful server. Servers and laptops were connected directly with a patch cable or via 1GBit Cisco switch.
Server with Proxmox VM, Intel Xeon CPU 2xE-2378, Intel e810 NIC - 15000 concurrent calls (G.711a 20ms RTP)CPU: Intel(R) Xeon(R) E-2378 CPU @2.60GHz Single (HT ON)
RAM: 64Gb
HDD: 2x480 Gb, btrfs raid 1
OS: Proxmox VE 8.2 Kernel 6.8
NIC: Intel e810 2x25G (10G ports). NICs are passed to VM as virtual functions with SR-IOV
1x VF SIP / 1x RTP control / 6x RTP load
OS: Windows 2016 Trial
ExecStart=/usr/bin/bash -c '/usr/bin/echo 7 > /sys/class/net/ens1f1np1/device/sriov_numvfs'
[Unit]
Wants=network-online.target
After=network-online.target
Description=Script to enable SR-IOV on boot
[Service]
Type=oneshot
# Starting SR-IOV
ExecStart=/usr/bin/bash -c '/usr/bin/echo 7 > /sys/class/net/ens1f0np0/device/sriov_numvfs'
ExecStart=/usr/bin/bash -c '/usr/bin/echo 7 > /sys/class/net/ens1f1np1/device/sriov_numvfs'
[Install]
WantedBy=multi-user.target
Dedicated Server with 2x16x2.7GHz Xeon E5-2680 CPU, 2x4x1Gbit network - 10000 concurrent calls (G.711a 20ms RTP), 50 calls per second
- OS: Windows Server 2016 Standard
- 2 of 4x1Gbit port Intel network cards at each of the 2 servers
- Latest NIC drivers (for date of the test: 2022-09-19)
- Maximum number of RSS queues = 4
- Receive buffers = maximum
- Receive side scaling = enabled
- RSS base processor number = 2,3,4...9 (for the 8 NICs). Note: need to check actually used CPU core numbers using task manager
- IP addresses were assigned to same subnet, no grouping, 1 separate IP per each of the 8 NICs
- SIP Tester settings
- CallXML script was configured to use randomly 1 of 7 NICs for RTP, and 1 NIC for SIP. Call receiver script:
<callxml>Call generator script:
<accept codec="G711A" localRtpAddress="$randswitch(10.1.1.211,10.1.1.212,10.1.1.213,10.1.1.214,10.1.1.215,10.1.1.216);" />
<playaudio value="music2.wav" repeat="infinite" maxtime="500s" />
<exit />
</callxml><callxml>
<call value="sip:$rand(1001,1999);@10.1.1.210:5060" codec="G711A" maxringtime="60s" localRtpAddress="$randswitch(10.1.1.111,10.1.1.112,10.1.1.113,10.1.1.114,10.1.1.115,10.1.1.116);">
</call>
<on event="answer">
<playaudio value="music.wav" repeat="infinite" maxtime="$rand(300,500);s" />
<exit />
</on>
</callxml> - We have configured 3 instances (3 exe files running from 3 different directories) at each of 2 servers. Instances 1 and 2 generated 5000+5000=10000 concurrent calls, 3rd instance was used for call quality measurement with 50 concurrent calls
- Settings:
- LocalSipPort = 5060, 5070, 5080 (for the 3 instances)
- LocalSipAddress = [NIC 8]
- MediaTransportPoolInitialSocketsC untPerInterface = 2000 (for 2 instances)
- MediaTransportPoolMinPort = 16000, 20000, 24000 (for the 3 instances)
- EnableLightweightMediaProcessing = 1 (for 2 instances)
- EnablePacketAnalyser = 0 (for 3 instances)
- EnableCallMeasurements = 0 (for 2 instances)
- AffinityMask* settings have been set to have the instances running at separate CPU cores (this is very important). Distinct CPU cores must be assigned for NICs and SIP Tester instances. For stable work, without peak overloads each core should be loaded for less than 50%
- MediaThreadsCount was set to number of CPU cores for the media threads, in this case "11" or "12"
- Call generation parameters:
- Interval between calls = 50ms (max. 25CPS)
- Limit number of concurrent calls: 5000 (for first 2 instances), 50 (for 3rd instance)
- CallXML script was configured to use randomly 1 of 7 NICs for RTP, and 1 NIC for SIP. Call receiver script:
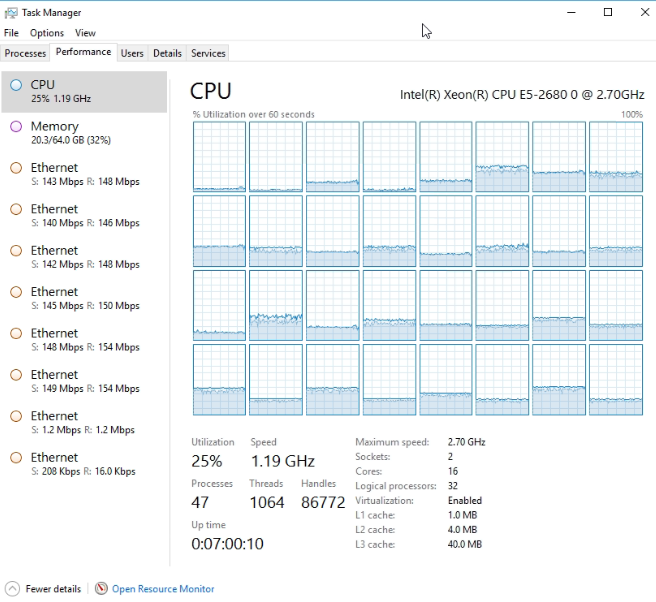
- RTP RTT (round trip delay): peak = 6.2ms, average = 3.46ms, 99-percentile = 6ms
- Zero packet loss
- 1.27ms.>Max. RFC3550 jitter = 1.27ms, average = 0.82ms
Dedicated Server with 4x3.2GHz Xeon E3-1225 v2 CPU, 250Mbit network - 15000 concurrent calls (NO RTP), 500 calls per second
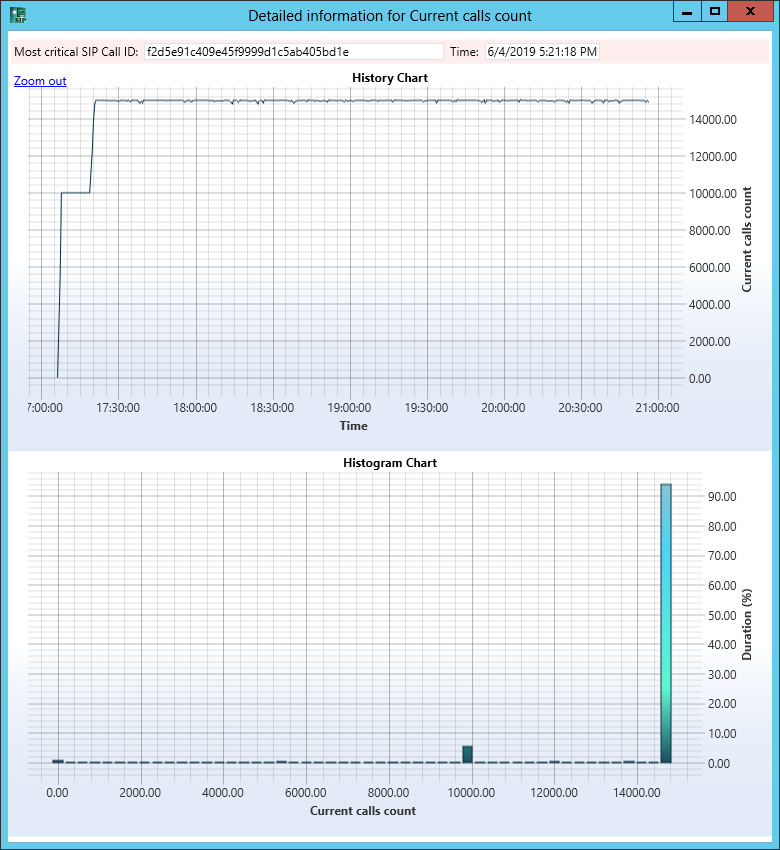
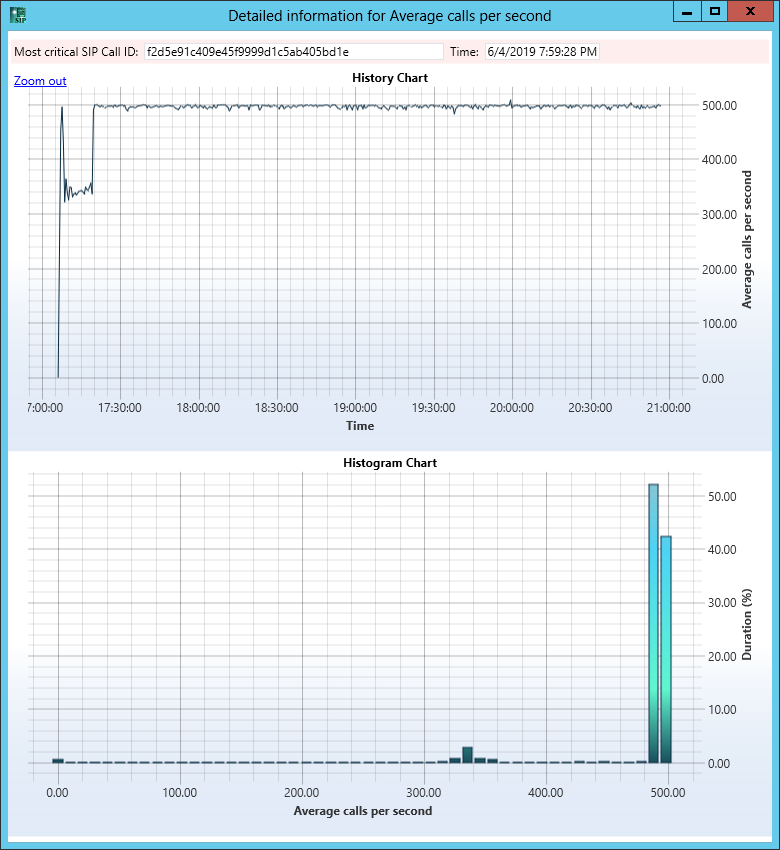
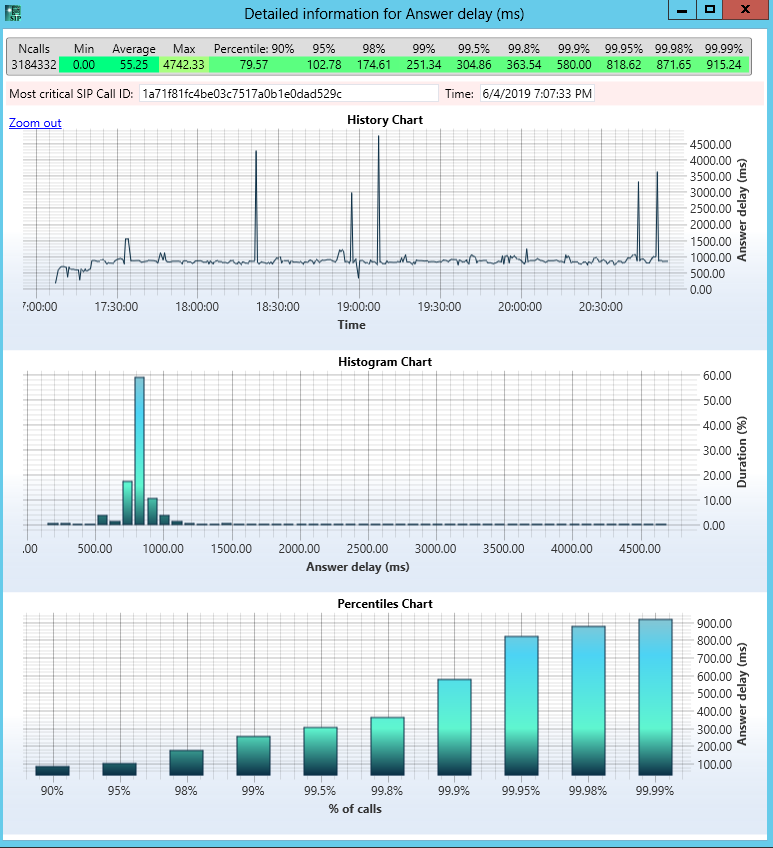
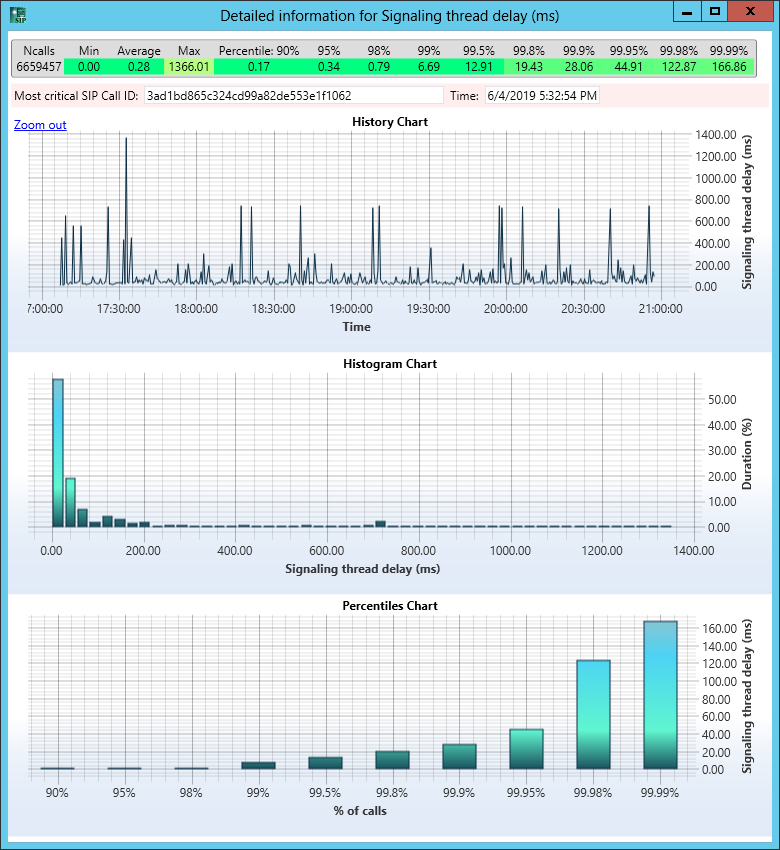
Delay in SIP Tester's SIP thread (self-tested):
Server with 4x3.9GHz Intel Core i7-3770 CPU, 1GBit ethernet - 5400 G.729 channels (ptime=50)
- EnableLightweightMediaProcessing = 1
- EnableLightweightMediaProcessingPlayback = 1
- EnablePacketAnalyser = 1
- ForcedAudioCodec = G729
- RtpTxPacketTime = 50ms
- LogLevel = 0
- Call duration = random from 80 to 90 seconds, configured at UAC instance
Caller (UAC) side measurements
Distribution of RX RFC3550 jitter and number of current calls: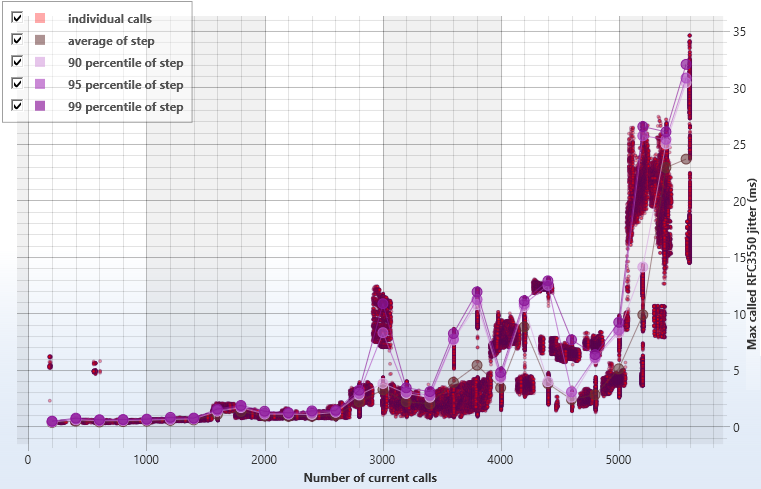
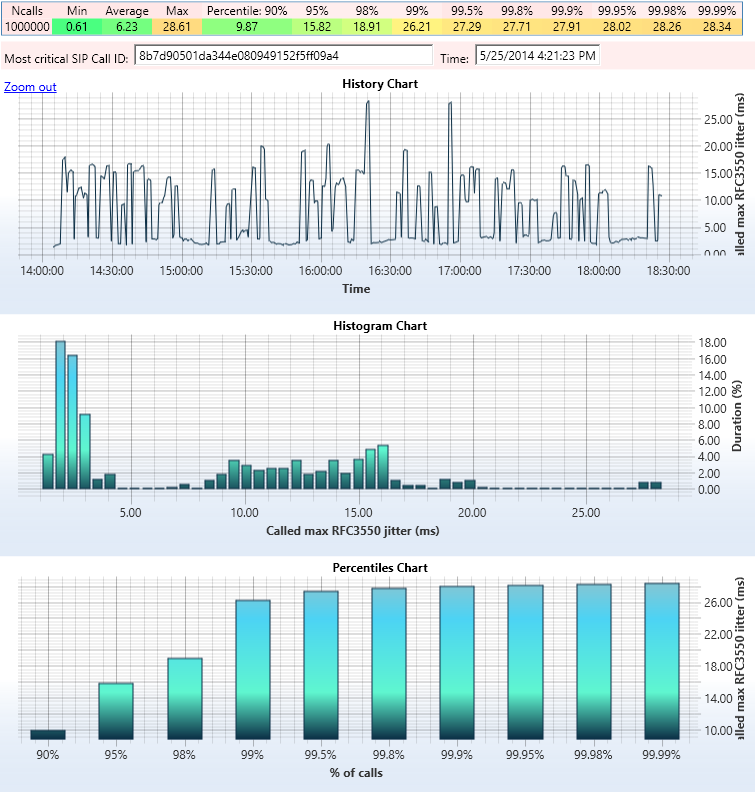
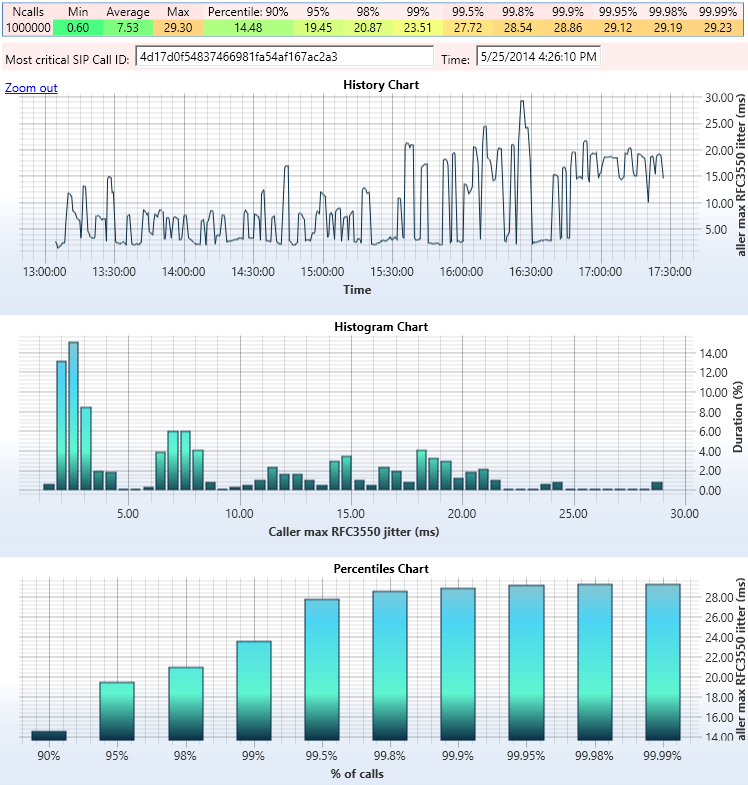
For 5400 concurrent calls, 1M simulated calls we have got 0% lost packets, max RX RFC3550 jitter = 28.61ms and max answer delay = 1048ms (view detailed report).
RX RFC3550 jitter history and histogram:
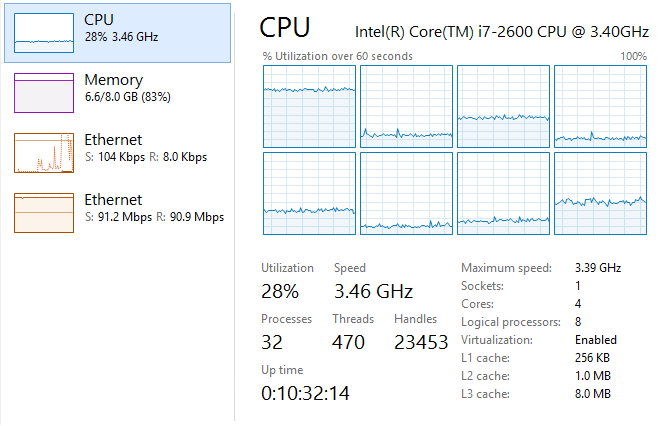
CPU and network load: 91MBps, 28% of CPU
Called (UAS) side measurements
For 5400 concurrent calls, 1M simulated calls we have got 0% lost packets, max RX RFC3550 jitter = 28.61ms (view detailed report). Note that all 1000092 INVITE packets reached the called side.RX RFC3550 jitter history and histogram:
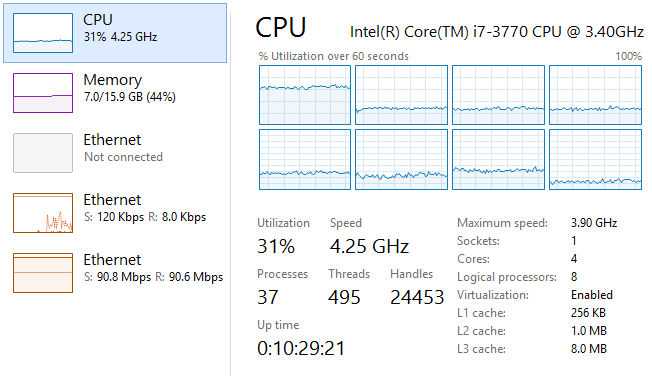
CPU and network load: 91MBps, 31% of CPU
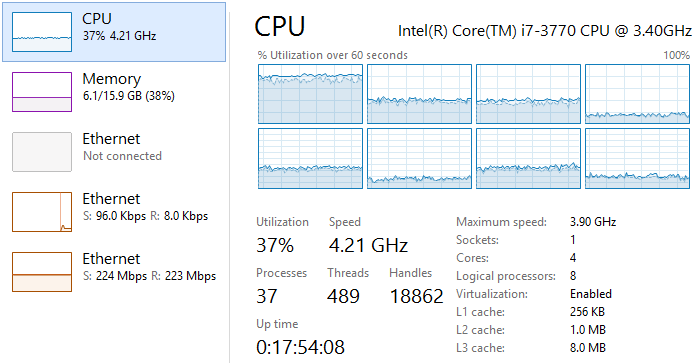
Server with 4x3.9GHz Intel Core i7-3770 CPU, 1GBit ethernet - 2600 G.711 channels (ptime=20)
- EnableLightweightMediaProcessing = 1
- EnablePacketAnalyser = 1
- ForcedAudioCodec = G711a
- RtpTxPacketTime = 20ms
- LogLevel = 0
- Call duration = random from 80 to 90 seconds, configured at UAC instance
Caller (UAC) side measurements
Distribution of RX RFC3550 jitter and number of current calls: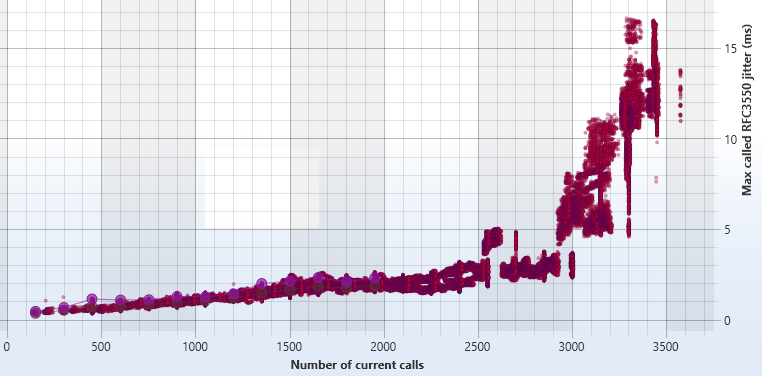 For 2600 concurrent calls, 1M simulated calls we have got max RX RFC3550 jitter = 16.37ms and max answer delay = 473 (view detailed report).
RX RFC3550 jitter history and histogram:
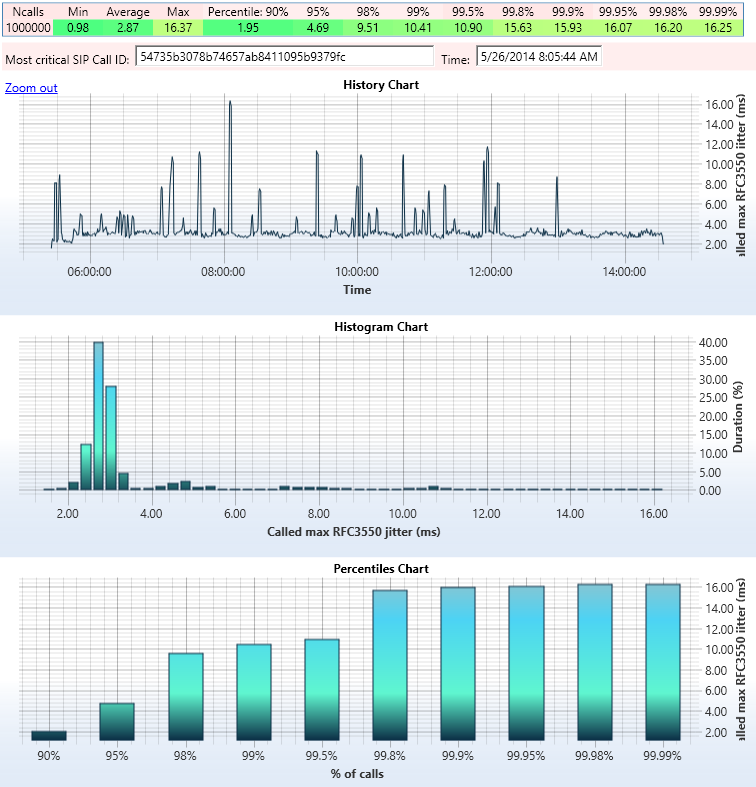
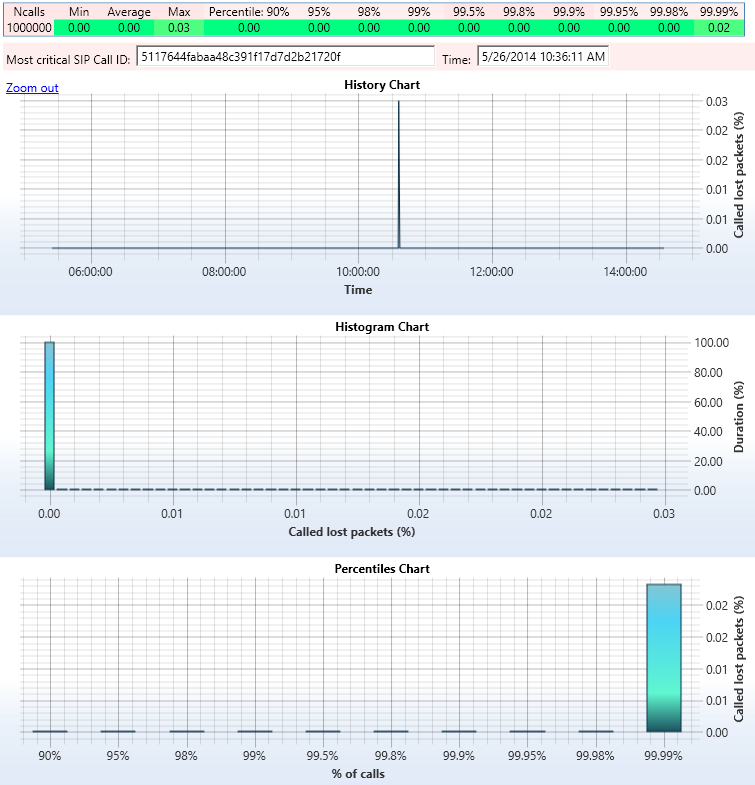
RX lost packets history and histogram: there was one gap during 10 hours of test - 0.03% dropped packets per single call
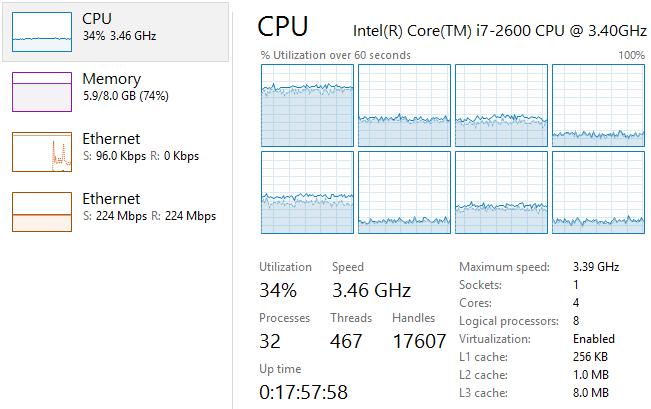
CPU and network load: 224MBps, 34% of CPU
Called (UAS) side measurements
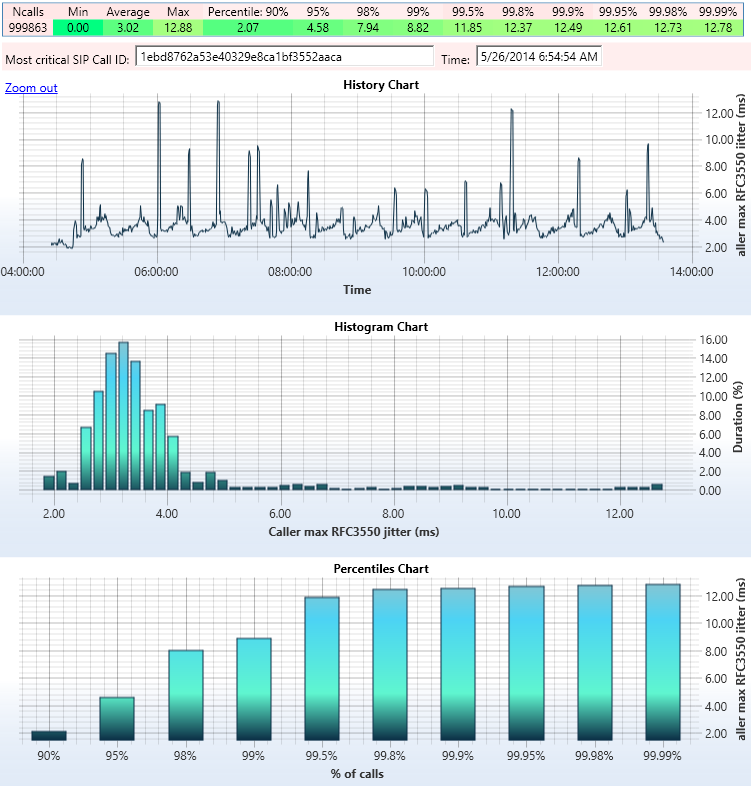
For 2600 concurrent calls, 1M simulated calls we have got max RX RFC3550 jitter = 12.88ms (view detailed report).RX RFC3550 jitter history and histogram:
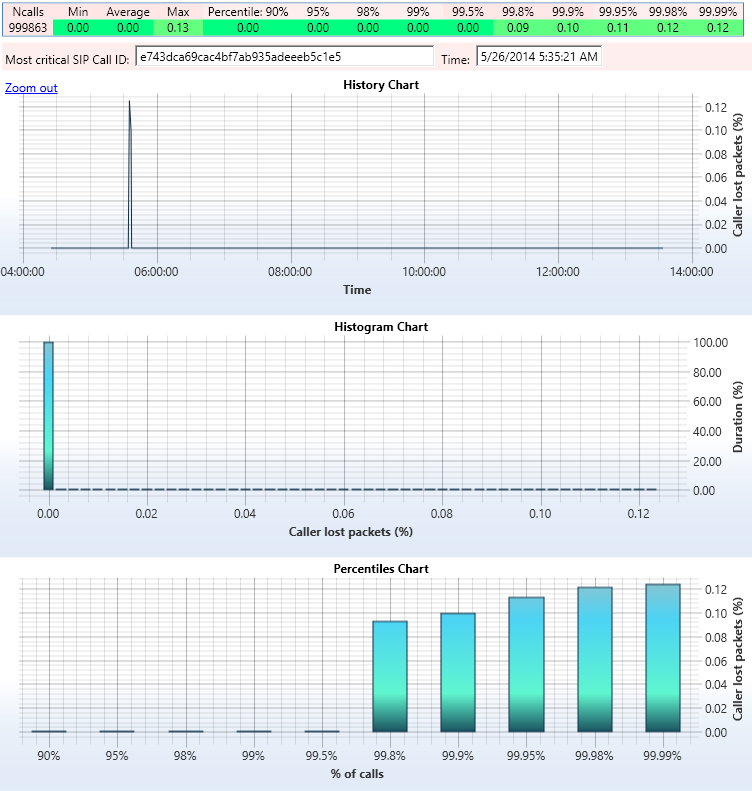
RX lost packets history and histogram: there was one gap during 10 hours of test - 0.13% dropped packets per single call
CPU and network load: 224MBps, 37% of CPU
Server with 4x3.9GHz Intel Core i7-3770 CPU, 5x1GBit - 8000 G.711 channel, SIP+RTP+DTMF (WinPCAP RTP sender mode, WAV playback, ptime=20)
- EnableWinpcapRtpSender = 1
- EnablePacketAnalyser = 1
- ForcedAudioCodec = G711U
- RtpTxPacketTime = 20ms
- LogLevel = 0
- DisablePacketAnalysisOnIpAddresses = "10.10.10.41;10.10.10.42;10.10.10.43;10.10.10.44" (call generator) and "10.10.10.61;10.10.10.62;10.10.10.63;10.10.10.64" (call receiver). Note: please enter the setting value without the " character.
- Call duration = 220 seconds, random, logarithmic probability distribution
- Max time to wait answer at UAC: 30 seconds, random, logarithmic probability distribution
- Delay before answer at UAS: 10 seconds, random, logarithmic probability distribution
- Audio playback: music.wav, looped
- Number of DTMF digits sent: 1
- Target number of channels (concurrent calls): 8000
- Target calls per second: 100
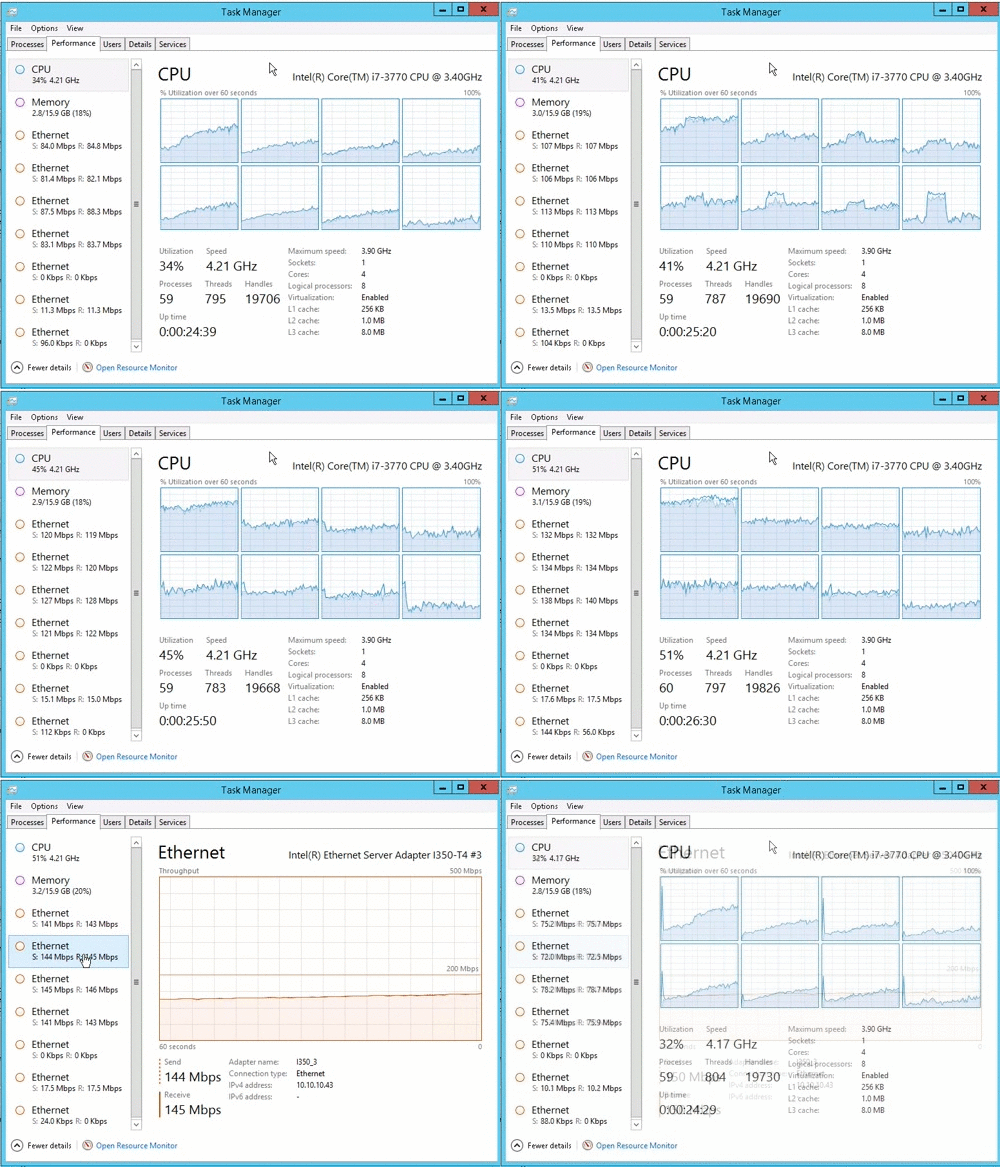
Note: after the setup please make few test calls and capture SIP+RTP traffic using Wireshark to make sure that RTP packets go via correct network interface. There can be issues with windows routing table (e.g. incorrect "metric") when only one adapter is used for all RTP streams. Also, run task manager and check that bandwidth is distributed equally between the network adapters, and CPU load is distributed evenly between cores. If there is overload on a CPU core, set its bit to zero in setting "AffinityMaskForProcess". If CPU gets overloaded on some network adapter, the software writes error to logs. More tips on optimizing CPU performance: see here
Script for call generator:<block probability="0.03">
<assign var="localRtpAddress" values="10.10.10.4" />
<call maxringtime="$rand(30000);ms" value="sip:111@10.10.10.6:5070" codec="G711U" localRtpAddress="$localRtpAddress;">
<on event="answer">
<playaudio value="music.wav" repeat="infinite" maxtime="$rand(2000);ms" />
<playdtmf value="4" />
<playaudio value="music.wav" repeat="infinite" maxtime="$rand(200000);ms" />
<exit />
</on>
</call>
<exit />
</block>
<assign var="localRtpAddress" values="10.10.10.41;10.10.10.42;10.10.10.43;10.10.10.44" />
<call maxringtime="$rand(30000);ms" value="sip:111@10.10.10.6:5070" codec="G711U" localRtpAddress="$localRtpAddress;">
<on event="answer">
<playaudio value="music.wav" repeat="infinite" maxtime="$rand(2000);ms" />
<playdtmf value="4" />
<playaudio value="music.wav" repeat="infinite" maxtime="$rand(200000);ms" />
<exit />
</on>
</call>
</callxml>
<wait value="$rand(10000);ms" />
<block probability="0.03">
<assign var="localRtpAddress" values="10.10.10.6" />
<accept localRtpAddress="$localRtpAddress;" />
<playaudio value="music.wav" repeat="infinite" maxtime="$rand(2000);ms" />
<playdtmf value="3" />
<playaudio value="music.wav" repeat="infinite" maxtime="$rand(200000);ms" />
<exit />
</block>
<assign var="localRtpAddress" values="10.10.10.61;10.10.10.62;10.10.10.63;10.10.10.64" />
<accept localRtpAddress="$localRtpAddress;" />
<playaudio value="music.wav" repeat="infinite" maxtime="$rand(2000);ms" />
<playdtmf value="3" />
<playaudio value="music.wav" repeat="infinite" maxtime="$rand(200000);ms" />
<exit />
</callxml>
Screen recordings
Caller (UAC) side measurements
Distribution of RX RFC3550 jitter and number of current calls: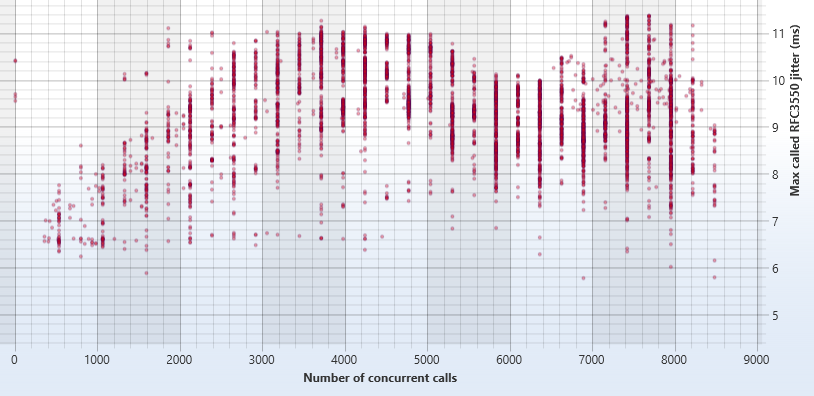 For 8000 concurrent calls, 100CPS, 1M simulated calls we have got max RX RFC3550 jitter = 21ms and max 100 (Trying) delay = 781ms
(view detailed report + full configuration).
No RTP packets have been lost (0% packet loss)
CPU and network load: 150MBps x 4 (RTP 97%) + 17.4Mbps (SIP+RTP 3%), 48% of CPU
Called (UAS) side measurements
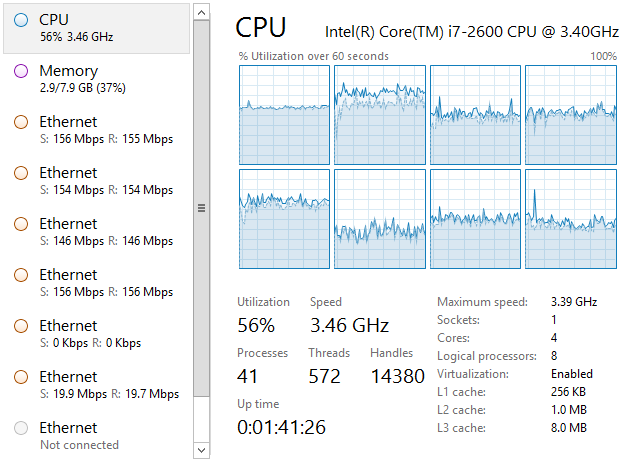
For 8000 concurrent calls, 1M simulated calls we have got max RX RFC3550 jitter = 14.7ms (view detailed report + full configuration). No RTP packets have been lost (0% packet loss).CPU and network load: 150MBps x 4 (RTP) + 22.5Mbps (SIP), 56% of CPU
Server with 4x3.9GHz Intel Core i7-3770 CPU, 1GBit - 1000 calls per second (WinPCAP RTP sender mode)
- EnableWinpcapRtpSender = 1
- EnablePacketAnalyser = 1
- ForcedAudioCodec = G711a
- RtpTxPacketTime = 20ms
- LogLevel = 0
- Call duration = 1 second
- Max calls per second = 1000
- Max concurrent calls = 1200
Caller (UAC) side measurements
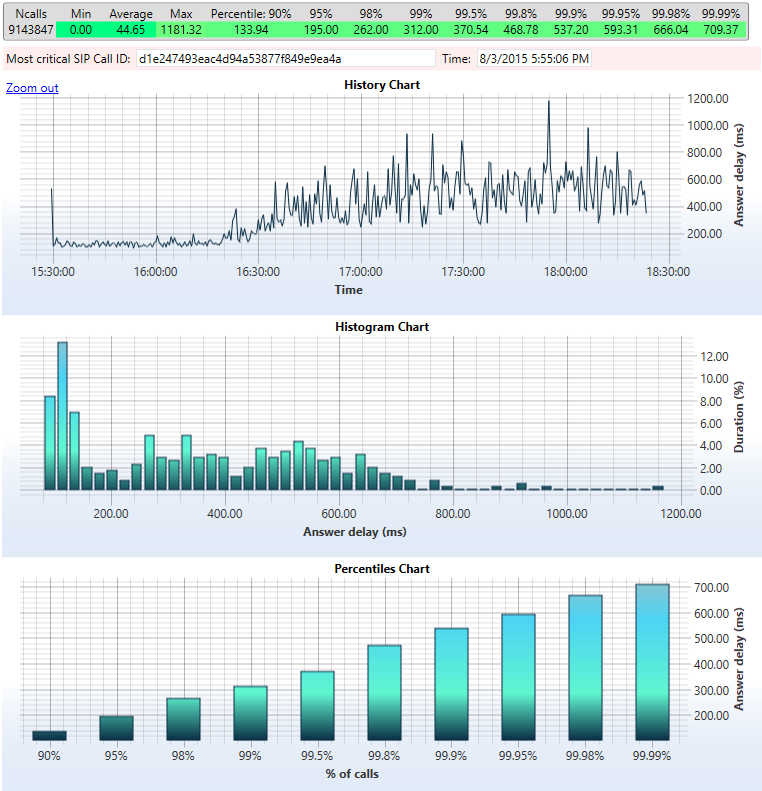
For 9.85M simulated calls we have got max answer delay = 1000.41ms (view detailed report + full configuration). No RTP packets have been lost (0% packet loss).Answer delay history and histogram:
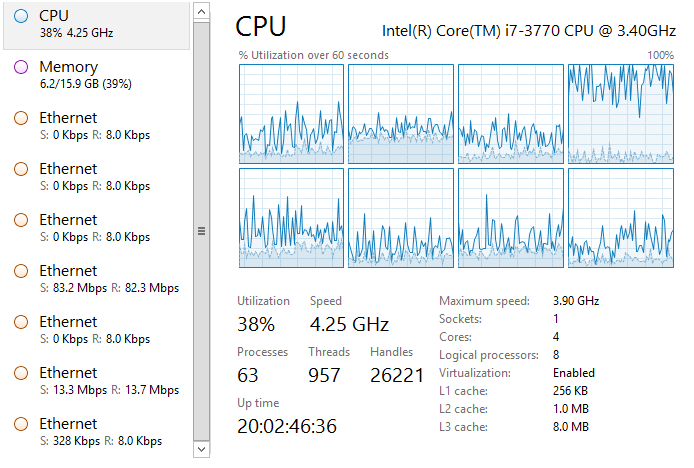
CPU and network load: 82.3Mbps (RTP) + 13.7Mbps (SIP), 38% of CPU. Core #4 is taken by SIP thread

Called (UAS) side measurements
For 9.85M simulated calls we have got max answer delay = 1000.41ms, same as measured at UAC side - no network delays (view detailed report + full configuration). No RTP packets have been lost (0% packet loss).CPU and network load: 52.5MBps (RTP) + 23.7Mbps (SIP), 32% of CPU
Laptop with 2x2.4GHz Intel Pentium 2020M CPU, 100Mbit ethernet - 1200 G.729 channels (ptime=50)
- EnableLightweightMediaProcessing = 1
- EnableLightweightMediaProcessingPlayback = 1
- EnablePacketAnalyser = 1
- ForcedAudioCodec = G729
- RtpTxPacketTime = 50ms
- LogLevel = 0
- Call duration = random from 80 to 90 seconds, configured at UAC instance
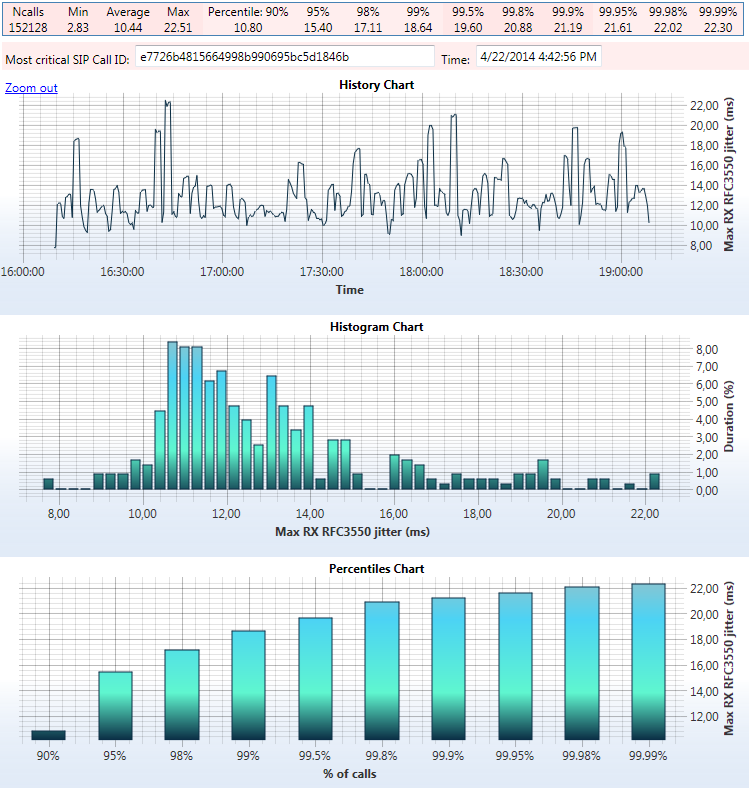
This chart shows history of measured RFC3550 jitter over time and histogram for 1200 concurrent calls:
 Following chart shows distribution of measured RFC3550 jitter and number of current calls:
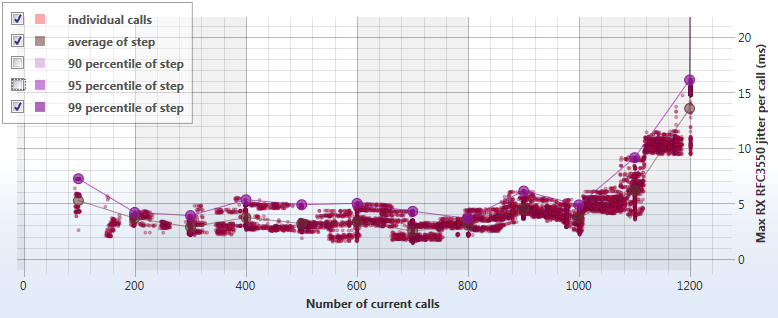 The charts were generated by UAC (call generator) instance of SIP Tester.
Laptop with 2x2.4GHz Intel Pentium 2020M CPU, 100Mbit ethernet - 550 calls per second (no RTP, SIP only)
Laptop with 4x1.6GHz AMD A8 CPU, 1GBE - 1200 G.729 channels (ptime=50)
- EnableLightweightMediaProcessing = 1
- EnableLightweightMediaProcessingPlayback = 1
- EnablePacketAnalyser = 1
- ForcedAudioCodec = G729
- RtpTxPacketTime = 50ms
- LogLevel = 0
- Call duration = random from 40 to 50 seconds, configured at UAS instance
Following chart shows distribution of measured RFC3550 jitter and number of current calls:
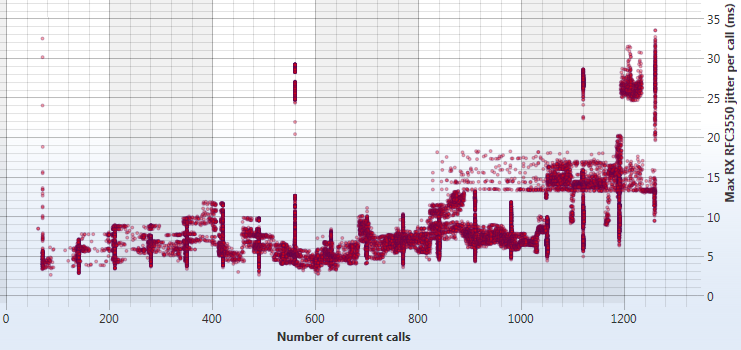 The chart was generated by UAC (call generator) instance of SIP Tester.
Laptop with 4x1.6GHz AMD A8 CPU, 1GBE - 600 G.711 channels (ptime=20)
- EnableLightweightMediaProcessing = 1
- EnableLightweightMediaProcessingPlayback = 1
- EnablePacketAnalyser = 1
- ForcedAudioCodec = G711a
- RtpTxPacketTime = 20ms
- LogLevel = 0
- Call duration = random from 80 to 90 seconds, configured at UAC instance
Following chart shows distribution of measured RFC3550 jitter and number of current calls:
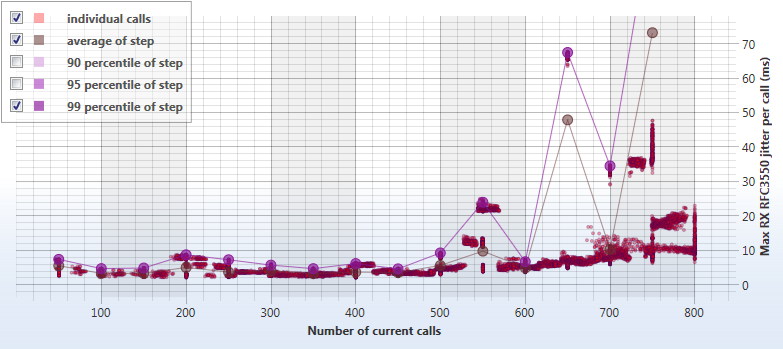 The chart was generated by UAC (call generator) instance of SIP Tester.
Laptop with 4x1.6GHz AMD A8 CPU, 1GBE - 150 G.711 channels (ptime=20, debug media recording)
- EnableLightweightMediaProcessing = 0
- DebugMedia = 1
- EnablePacketAnalyser = 1
- ForcedAudioCodec = G711a
- RtpTxPacketTime = 20ms
- LogLevel = 0
- Call duration = random from 80 to 90 seconds, configured at UAC instance
Following chart shows distribution of measured RFC3550 jitter and number of current calls:
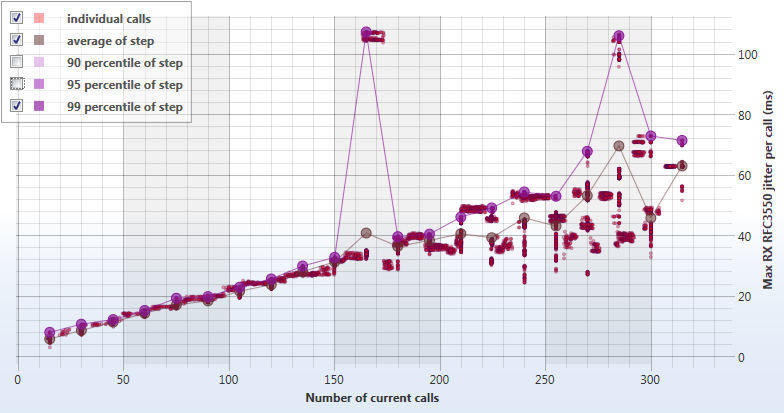 The chart was generated by UAC (call generator) instance of SIP Tester.
Virtual machines
VMWare platform
We have achieved performance of 2000 G.711 channels, 100 calls persecond on a VMWare-based virtual machine with 12 virtual cores and 3 virtual network adapters. Following scripts were used for call generator and receiver:<assign values="10.169.96.102;10.169.96.103;10.169.96.104" var="rtpIp" />
<call value="sip:$rand(13108790819,13208790819);@10.169.96.182:5070" maxtime="10000ms" localRtpAddress="$rtpIp;" />
<on event="answer">
<playaudio value="C:\wav\hello.wav" repeat="infinite" maxtime="20s" />
<exit />
</on>
</callxml>
<wait value="5s" />
<assign var="rtpIp" values="10.169.96.182;10.169.96.183;10.169.96.184" />
<accept localRtpAddress="$rtpIp;" />
<playaudio value="C:\wav\music.wav" repeat="infinite" maxtime="20s" />
<exit />
</callxml>
VirtualBox platform
| Host hardware | Host software | VM configuration | Attempted calls | Concurrent calls | Max CPS | Call duration | Codec configuration | SIP Tester configuration | Max call jitter (avg/90-percentile/max, ms) | Max call delta (avg/90-percentile/max, ms) | Lost packets |
| Intel Core i7-3770@3.4GHz 8 cores | WinServer2012 64bit, VirtualBox 4.3.16 | 4 cores | 10000 | 450 | 5 | 90sec | G711 ptime=20ms | 16 media threads, LWMP,PA on | 12,8/13/28,2 | 75/53,4/345 | 0% |
| Intel Core i7-3770@3.4GHz 8 cores | WinServer2012 64bit, VirtualBox 4.3.16 | 4 cores | 10000 | 520 | 8 | 90sec | G729 ptime=20ms | 16 media threads, LWMP,PA on | 13,1/12,2/75,6 | 73,2/48/519 | 0% |
| Intel Core i7-3770@3.4GHz 8 cores | WinServer2012 64bit, VirtualBox 4.3.16 | 4 cores | 260000 | 450 | 5 | 90sec | G711 ptime=20ms | 16 media threads, LWMP,PA on | 11,9/12,9/19,1 | 60,7/54,4/377 | 0% |
| Intel Core i7-2660@3.4GHz 8 cores | WinServer2012 64bit, VirtualBox 4.3.16 | 4 cores | 165000 | 450 | 5 | 90sec | G711 ptime=20ms | 16 media threads, LWMP,PA on | 14.5/15.3/28.7 | 111/154/315 | 0% |
| Intel Core i7-3770@3.4GHz 8 cores | WinServer2012 64bit, VirtualBox 4.3.16 | 2 cores | 5000 | 180 | 2 | 90sec | G711 ptime=20ms | 16 media threads, LWMP,PA on | 24/40/77 | 204/199/1133 | 0% |
| Intel Core i7-3770@3.4GHz 8 cores | WinServer2012 64bit, VirtualBox 4.3.16 | 2 cores | 2000 | 100 | 2 | 90sec | G711 ptime=20ms | 16 media threads, LWMP,PA on | 8,7/10,44/14,45 | 40/40/121 | 0% |
| Intel Core i7-3770@3.4GHz 8 cores | WinServer2012 64bit, VirtualBox 4.3.16 | 2 cores | 2000 | 130 | 2 | 90sec | G711 ptime=20ms | 16 media threads, LWMP,PA on | 10/12,5/26,6 | 43,8/49,9/111 | 0% |